A TIMELINE FOR THE PLANET
click
for Home
page
Continental
Drift
These maps show a succession of two or even three
different supercontinents, stretching back over a thousand million years. Not surprisingly the evidence gets
increasingly uncertain as we go back in time.
However scientists believe that there were several more even earlier supercontinents – at more or less 500 million
year intervals – stretching back until the planet was young.
We’ve all heard of Continental Drift by now, with the
different land masses wandering all over the globe. To begin with it was just theory. But now satellites can actually measure the
movement. On average it’s about 15
millimetres a year, or about the speed that your fingernails grow. Some are moving much faster. The Indian landmass, for example, is
galloping northwards at around 2 centimetres a year; and a huge chunk of it has
already buried itself beneath the underbelly of
Geologists and Palaeo-geographers have worked out how
the landmasses have moved in the past – how they have clumped together to form
super-continents, and then split up again and gone their separate ways.
The maps
These maps don’t show the actual shape of the
continents in times past. Neither could
they. A lot of land has certainly been
eroded away since, and more will have been deeply buried under other land – as
These images simply show the believed disposition of
present land masses at the time.
There are thought to have been at least 3
supercontinents, even earlier than the ones we depict below, stretching back
more than 2½ thousand million years.
This was the heyday of bacteria, when they were the only life
around.
The hard evidence for these early supercontinents is
long gone. But every 500 million years
or so geologists have spotted signs of mountain building episodes, as the
individual landmasses came together.
Mountain building is happening today in various places. The most spectacular is the
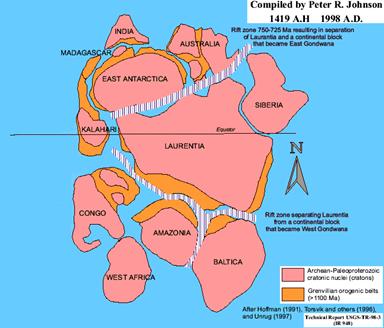
Rodinia
 This
is the ancient supercontinent of Rodinia, which came together around 1100
million years ago. It’s the earliest for
which there’s any hard evidence. To be
honest, there seems to be only just enough to be sure that it actually
existed.
This
is the ancient supercontinent of Rodinia, which came together around 1100
million years ago. It’s the earliest for
which there’s any hard evidence. To be
honest, there seems to be only just enough to be sure that it actually
existed.
It was the late Proterozoic when life was still
entirely microscopic – and of course very much all underwater.
The orange patches are mountain-building areas, and the hatched areas are where there are
signs of rifting. As we keep saying,
don’t expect things to be simple in this game.
The rest of the maps all come from Christopher R.
Scotese’s Paleo mapping project (www.scotese.com).
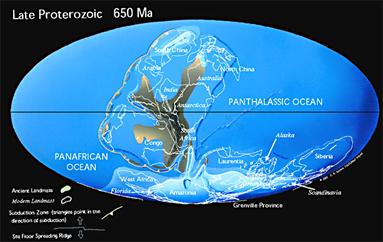
Panotia
 This
is the very late Proterozoic when,
according to Scotese, a new supercontinent was being formed called Pan(n)otia
(I’ve seen it spelled both ways). It’s
the first I’d heard of it, and a report in New
Scientist (20.10.07) suggests that Panotia only ever comprised part of the
total land anyway.
This
is the very late Proterozoic when,
according to Scotese, a new supercontinent was being formed called Pan(n)otia
(I’ve seen it spelled both ways). It’s
the first I’d heard of it, and a report in New
Scientist (20.10.07) suggests that Panotia only ever comprised part of the
total land anyway.
Apparently it was complete around 550 million years
ago. However instead of going on to join
the rest of the land to produce a proper supercontinent, it seems to have
broken up again during the Cambrian (as we’ll see).
The very late Proterozoic is also the time of the
terrible Varangerian ice age. Signs of glaciation have been found on almost every continent.
Cambrian
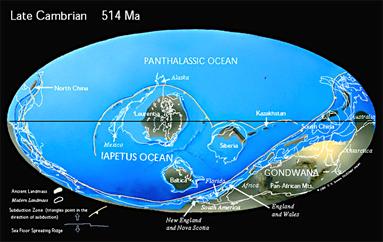
This is the world around the time of the great
Cambrian explosion (more) around 500
million years ago. That was when large
creatures suddenly appeared on the scene, apparently out of nowhere.
Panotia was well on the way to breaking up.
Ordovician
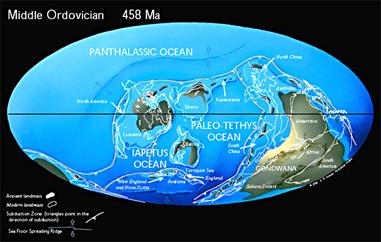
This is the Ordovician Period 460 million years
ago. Not a lot happens on the plate
tectonics front in a mere 40 million years – although maybe the landmasses are
beginning to get a little closer again.
Note the external ocean (more).
It’s the same as today’s Pacific, rechristened as the Panthalassa Ocean.
The mid Ordovician is the time of the Great
Diversification, when sea-floor-dwelling filter feeders exploded into the
greatest diversification of all time (more). Shortly after, round about the late
Ordovician, the plants invaded the land.
It was also one of the coldest times in Earth history, unless you
believe the full blown ‘Snowball Earth’ theory (more).
Silurian
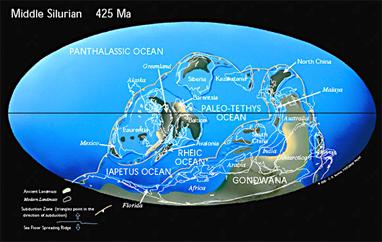
This is the middle Silurian, 435 million years
ago. There are now definite signs that
the next supercontinent, Pangaea, is beginning to build.
Not shown on this map are the increasing areas of
shallow sea around the margins of the continents (I got this from another
map). I’ve read that this is what you
would expect at this stage.
It is around the time that the animals invaded the
land. High sea levels would be just what
was needed to give them a leg up!
Pangaea
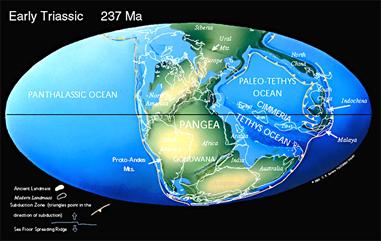 We
have a bigger gap here. This is the time
of the great supercontinent of Pangaea.
We
have a bigger gap here. This is the time
of the great supercontinent of Pangaea.
The amount of shallow sea has dropped, as the
sea-floor gets old and cold. The
Pacific/Panthalassa Ocean is of course still there. And we still have one large internal ocean, the
Tethys Sea.
These were hard times.
The large land mass generated widespread deserts, and the oxygen level
fell.
Shortly before this had come one of the greatest mass
extinctions of all time, the P-T event (more).
Jurassic
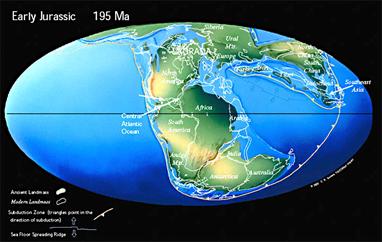
This is the early Jurassic. We can see that Pangaea is beginning to break
up.
The climate was much warmer than today, and stayed so
until the K-T extinction that killed off (most of)
the dinosaurs.
The early Jurassic was the start of the dinosaurs’
heyday – shortly after the Triassic extinction had killed off most of the
competition. Primitive mammals found a
niche for themselves too, but it was a pretty insignificant one.
Cretaceous
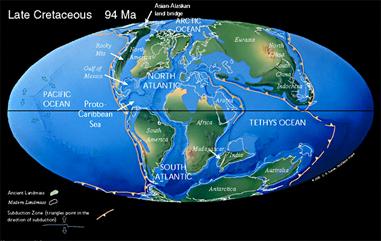
This is the late Cretaceous. The break-up of Pangaea is complete. The Atlantic Ocean is beginning to open up,
and the map is beginning to look recognisable.
The Cretaceous climate was still balmy, right up to
the poles. Dinosaurs and palm trees
lived in both polar regions.
Sea level was 100-200 metres higher than today, which
created plenty of shallow seas as the continental margins were flooded. They provided plenty of channels whereby warm
water could be transported towards the poles.
Today
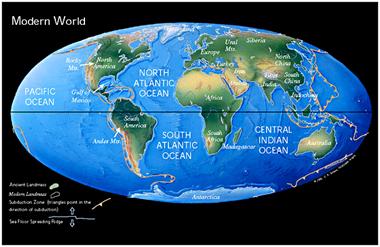 This
is today’s map. The Atlantic Ocean is
still growing at the moment. But fairly
soon (in geological terms) it will start to shrink again. It will develop its own ‘ring of fire’, as
the old tired ocean floor starts to get pushed under the continental crust (more).
This
is today’s map. The Atlantic Ocean is
still growing at the moment. But fairly
soon (in geological terms) it will start to shrink again. It will develop its own ‘ring of fire’, as
the old tired ocean floor starts to get pushed under the continental crust (more).
The past 60 million years or so have been a period of
fairly frenetic continental collision and mountain-building. India hit Asia. Spain hit France. Italy hit
France & Switzerland. Greece and
Turkey hit the Balkan region. Arabia hit Iran and Australia hit Indonesia. Together these collisions finally
extinguished the once-great Tethys Ocean.
Next
supercontinent
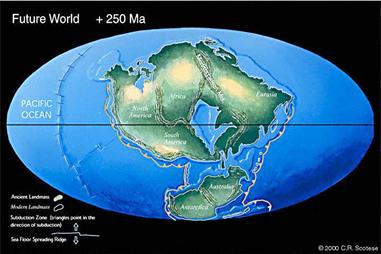
And this is the world predicted for 250 million years
hence. It represents the final stages of
the building of the next supercontinent – or possibly the early stages of its
break-up. Australia/Antarctica are
still/again separate from the main land mass.
The north Atlantic has closed up again, though in a
different way from the past. In
particular Britain and Scandinavia have drifted north, and joined northern
Russia on the edge of the Pacific (or possibly the Arctic/Pacific) Ocean. The south Atlantic has become a large inland
sea and India and south-east Asia join up.
How do they
know?
The main weapon in the palaeo-mapper’s armoury is
‘palaeo-magnetism’.
Most if not all rocks are very slightly magnetic. They contain minute specks of iron oxide, and
these act like little compasses. (If
this reminds you of magnetic tape or computer media then full marks. But don’t push the comparison too far.)
If the rock should get melted then these little
compasses are free to align themselves with the Earth’s magnetic field – just
like your hiking compass does (not quite actually as we’ll see). When the rock solidifies again these little
compasses get locked in position. They
provide a recording of where North was at the time of solidification. This recording is permanent. The Earth’s field is far too weak to
overwrite it, unless the rock should get re-melted.
Something else important happens at the same
time. The atomic clock gets reset (more). This
means that the mappers also have the date on which the ‘recording’ was
taken.
Equally important, the recordings tell the mappers the
latitude of the place where the recording was taken.
It works like this.
An ordinary compass pretends that the Earth’s field runs along the
ground. But it only actually does this
near the Equator. Everywhere else it
dips downwards. And the further north or
south you are, the greater the angle of ‘dip’.
At the poles, the field dips straight down vertically, and an ordinary
compass is useless.
An ordinary compass only measures the ‘horizontal
component’ of the Earth’s field, because that’s what most of us want. Its dial is supported on a single pin
bearing. It you put the compass on its
side the dial slips off. But you can also get ‘dip’ compasses. Their dials are properly supported like a
bicycle wheel. You can put them on
their sides and measure the ‘vertical component’, or the angle of dip. With these you can work out your latitude
without bothering with a map. Likewise
the angle of dip, as recorded by a rock sample, tells the geologists what the
latitude was when the sample last solidified.
Any large land mass will have many sites where the
rock has suffered re-melting, and made its recordings. Hopefully the recordings will cover a wide
range of dates. This enables the mappers
to plot the movement of the land mass, north and south. If the recordings are reasonably dispersed,
then the mappers can also plot the rotation of the land mass as it waltzes
about the globe.
Unfortunately there’s no such simple tool for
measuring movement east and west.
Getting a handle on this involves detailed detective work and much trial
and error.
However the geologists can often tell when landmasses
came together and split apart and this helps a great deal. For example, if they find a geological
structure in Antarctica that is identical to one they’ve already seen in Canada
(I think I have the example right) then they must once have been adjoined. With any luck, they can also estimate when
this was.
But that’s not all.
The palaeontologists can often identify fossils that are identical on
parts of two widely-separated masses.
They must once have been adjoined too.
And again the palaeontolgists can often estimate when this was.
It has taken many decades for Scotese to come up with
his definitive maps. And not all
palaeo-mappers agree with him even now.
© C B Pease, January 08